The entire “Mr. Earth series” will share with you why the earth’s temperature continues to rise, and the problems and solutions caused by the increase in temperature.
The first chapter will explain through different information why it is said that the earth is now in fever (the temperature keeps rising). Sources for this chapter came from the World Meteorological Organization (WMO), the National Oceanic and Atmospheric Administration (NOAA), Berkeley Earth Organization and the Hong Kong Observatory (HKO).
Past and Present Temperature
The heat content at the surface of the Earth is mainly derived from the Sun. If the Earth has no atmosphere, laws of physics suggest that the average surface temperature of the Earth would be around -18°C. In addition, the data from WMO indicated that in the pre-industrial era (1850-1900), the average surface temperature of the earth was 13.7 degrees.
However, in the 18th century, the rapid development of economic and industrial activities led to the release of a large amount of greenhouse gases, which increased the concentration of greenhouse gases in the atmosphere, and the earth was like covered by an invisible large area (the greenhouse effect), leading to global warming. The earth’s surface temperature in 2020 is 14.9 degrees. At the same time, NOAA data pointed out that the global land and ocean surface temperature in 2020 is the highest temperature in 141 years of record, and the global average temperature in 2020 is also the second hottest year since 1850 (Berkeley Earth).
Ten Warmest Years (1880–2020)
The following list summarizes the Earth’s surface temperature and the average temperature of the Earth in the warmest ten years: (Note*: Due to the different temperature records between NOAA and Berkeley Earth, the below order is referenced to NOAA).
| Year | Global Combined Land and Ocean Temperature (from NOAA) | Global Mean Temperature (Berkeley Earth) | |
| 1 | 2016 | 1.00 | 1.29 ± 0.05 |
| 2 | 2020 | 0.98 | 1.27 ± 0.04 |
| 3 | 2019 | 0.95 | 1.25 ± 0.05 |
| 4 | 2015 | 0.93 | 1.15 ± 0.04* |
| 5 | 2017 | 0.91 | 1.18 ± 0.05* |
| 6 | 2018 | 0.83 | 1.11 ± 0.04 |
| 7 | 2014 | 0.74 | 1.01 ± 0.05* |
| 8 | 2010 | 0.72 | 1.03 ± 0.04* |
| 9 | 2013 | 0.68 | 0.95 ± 0.05 (ranked 13) |
| 10 | 2005 | 0.67 | — |
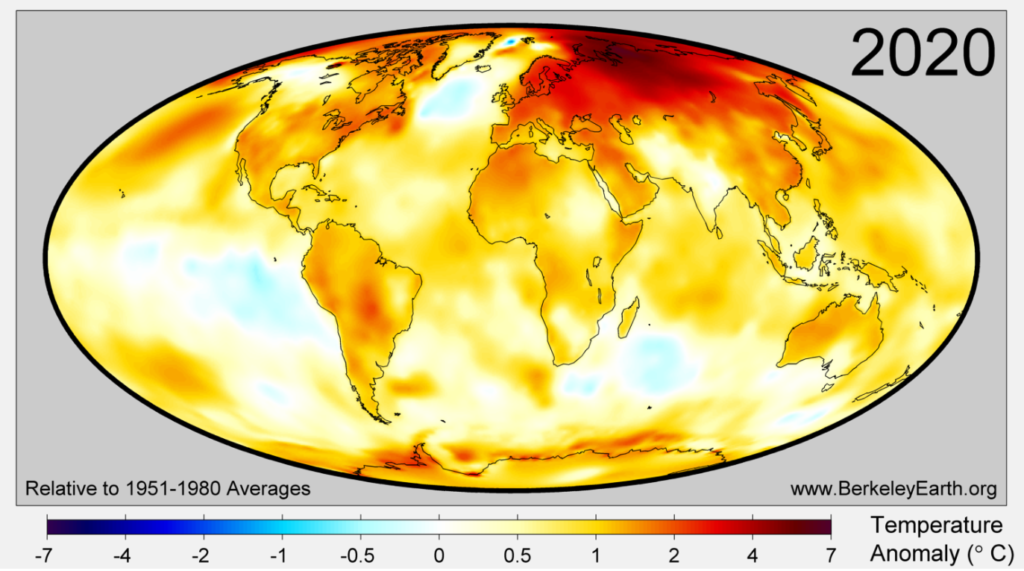
This graph shows the distribution of temperature in 2020 relative to the increase in the average temperature from 1951 to 1980.
The following YouTube also shares the global temperature anomalies in the past 140 years (1880-2020).
The United Nations has proposed an upper limit for global warming-the temperature is at most 1.5 degrees higher than the pre-industrial era. The increase in temperature will bring out serious disasters, such as sea-level rise, some coastal areas will be submerged; sea temperature and acidity will rise; agriculture and animal husbandry will face challenges.
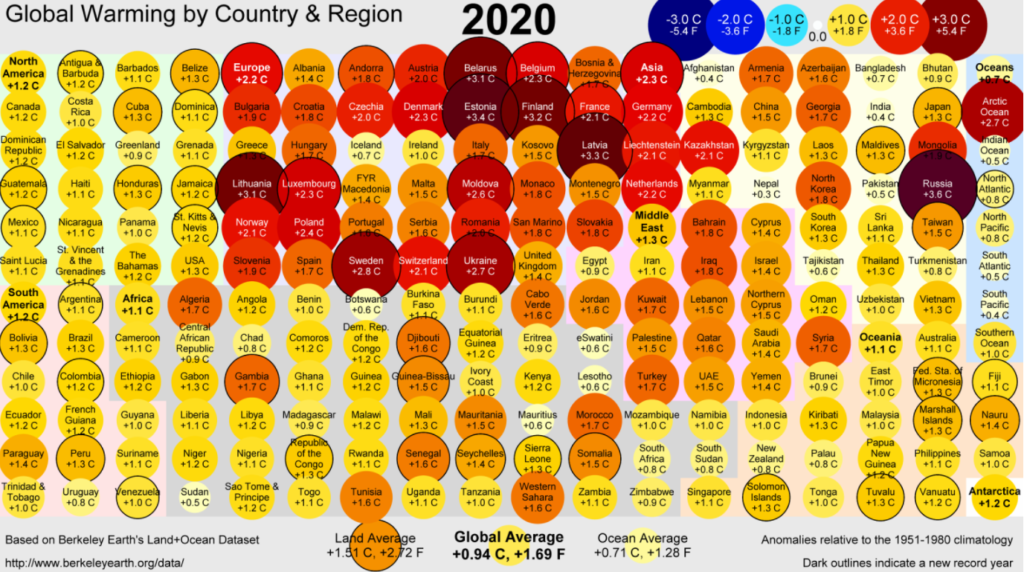
This is why you often hear that various countries take different measures to reduce greenhouse gas emissions and strive to limit the earth’s temperature to 1.5 degrees. The below diagram shows the temperature anomalies of various countries and regions (I think this graph is quite interesting, please try to find out if there is any information about your country/region!)
Future Temperature Predication
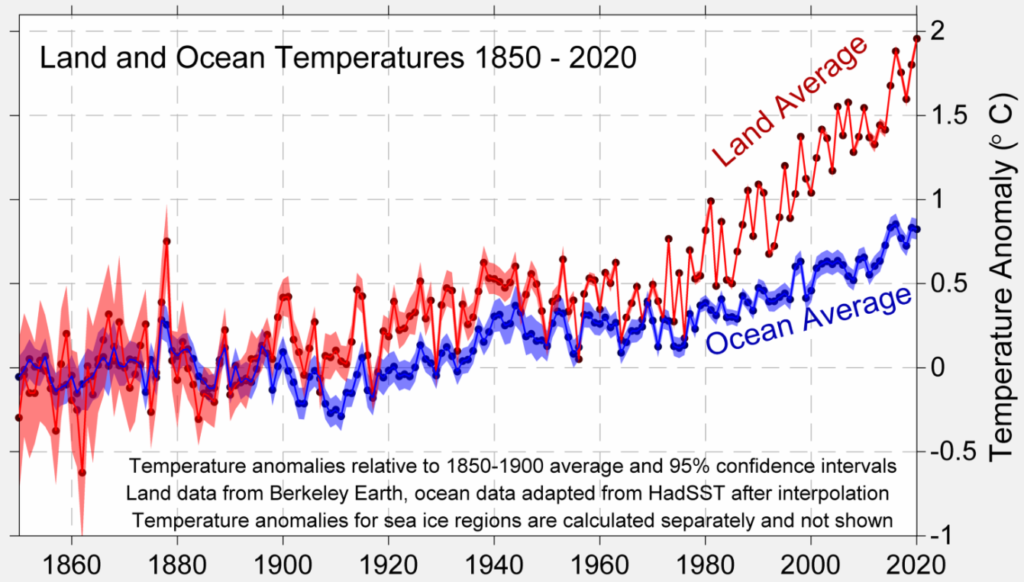
According to data from Berkeley Earth, it is nearly certain that 2021 will remain within the top-ten warmest years; however, there is a 50% chance that 2021 will rank no higher than 5th warmest year. There is only a remote chance that 2021 will be warmer than 2016. Refer to the below graph, at the current rate of progression, the increase in Earth’s long-term average temperature will reach 1.5 °C above the 1850-1900 average by around 2035 and 2 °C will be reached around 2065.
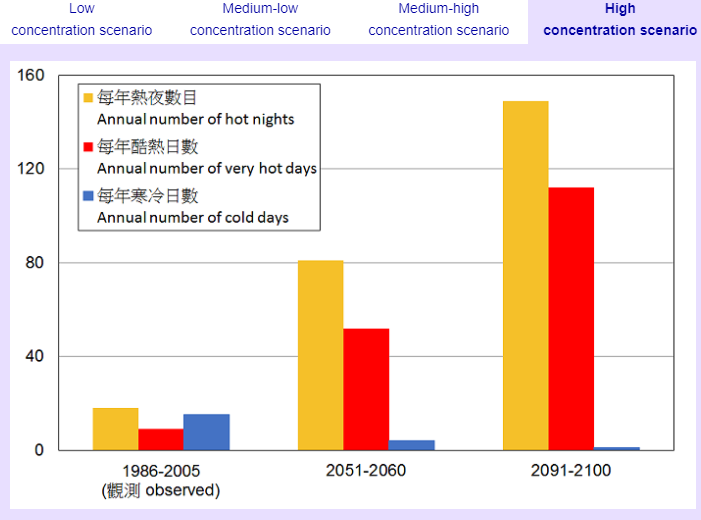
The data from HKO shows that under the high greenhouse gas concentration scenario, the temperature is expected to rise by 1.5-3°C and 3-6°C in the mid-21st century (2051-2060) and late 21st century (2091-2100) respectively, when compared to the 1986-2005 average of 23.3°C. Also, the annual number of hot nights (days with a minimum temperature of 28°C or above) and very hot days (days with a maximum temperature of 33°C or above) are expected to increase significantly in the 21st century, while the annual number of cold days (days with a minimum temperature of 12°C or below) is expected to drop. The following chart is the projected annual number of hot nights, very hot days and cold days in Hong Kong under the high greenhouse gas concentration scenario.
Discussion:
If you find that the temperature of your country/city has changed a lot in the past 10 years, you are welcome to leave a message.
References:
Webpages
https://www.bbc.com/zhongwen/trad/science-57749347 (in Chinese)
https://www.hko.gov.hk/en/climate_change/human_activities.htm
https://www.hko.gov.hk/en/climate_change/proj_hk_temp.htm
https://www.ncdc.noaa.gov/sotc/global/202013
http://berkeleyearth.org/global-temperature-report-for-2020/ https://public.wmo.int/en/media/press-release/2020-was-one-of-three-warmest-years-record


0 Comments